Everest Mapping: doing what can't be done.... |
|||
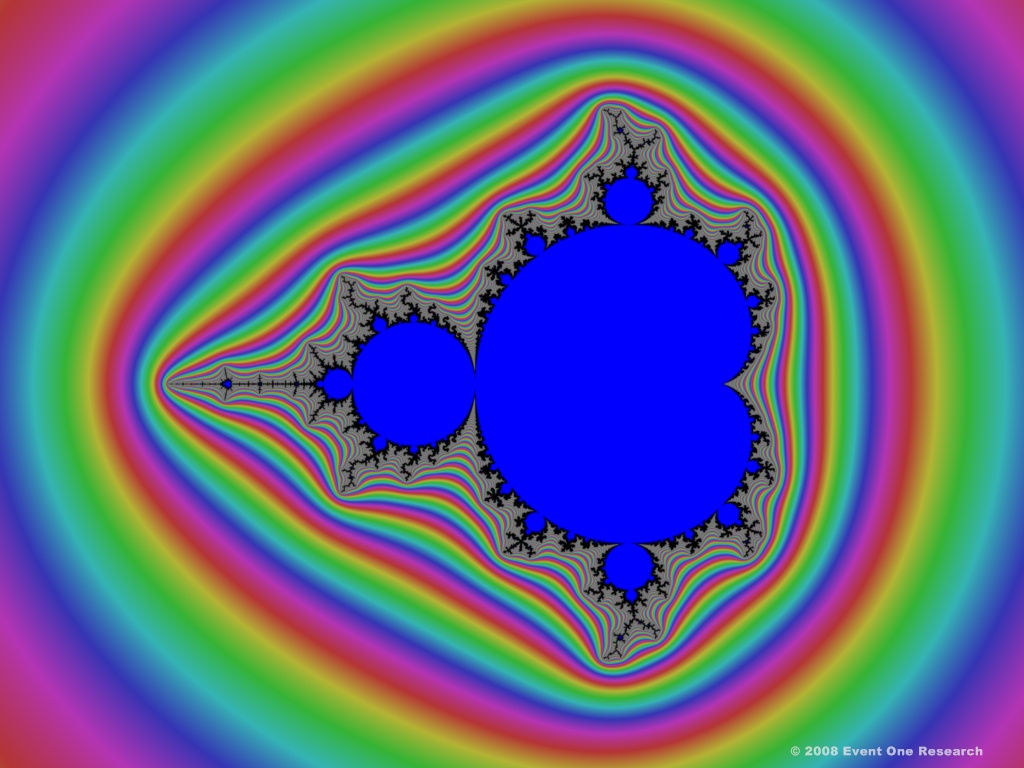
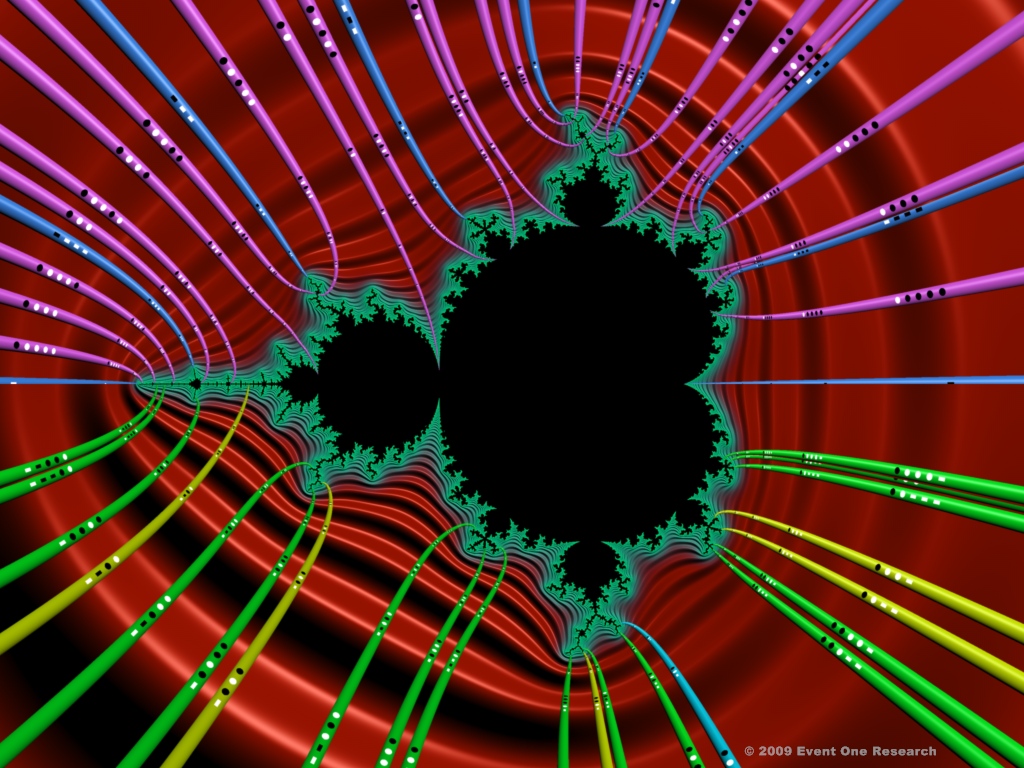
Event One Research announces an astonishing breakthrough in the production of images of the Mandelbrot and similar functions. Traditionally, only potential values are calculated. Fig.1 uses classic color-cycling applied to the potential value of each pixel. However, using proprietary arithmetic for complex numbers and a little bit of cool topological analysis, the iteration of field line values is realized. Fig.2 shows an historic first image of a color gradient for field line values- the other face of the Mandelbrot! Fig. 3 shows the application of computer graphics to the synthesis of field line objects. And, Fig 4.shows that the field line objects themselves can behave with the traditional "self-similarity" of fractals, wherein "deeper" field lines are kept shorter for consistency with intrinsic structure. This simultaneous mapping of both potential and field lines is called the Everest Mapping. |
|||
Fig.1 Potential Gradient |
Fig.2 Field Gradient |
Fig.3 Priority Field Lines |
Fig.4 Intrinsic Self-Similarity |
Over twenty years ago, the original fractal "artists", computer programmers and mathematicians, created stunning images. However, without the Everest Mapping, the full techniques of modern computer graphics could not be applied. After the initial fad wore-off, gifted computer artists created beautiful fantasia-like art by skillfully and artistically overlaying multiple images. However, the intricate and simple beauty of the underlying mathematical perfection became obscured. Click the "Gallery" navigation or "Links" button, to view images and videos that utilize the new Everest Mapping. |
|||